 Investor Slides
Is AI Good at Angel Investing?
September 23, 2026
Is AI a good investor? I wanted to find out with a game I built from my database of startup pitch decks.
I gave Jev one job: rate how likely each startup was to attract a large future funding raise, using the pitch deck in front of it. It returned a rating, not a yes-or-no investment decision.
A fixed rule used those ratings to decide when to invest, filling five slots as the decks arrived one by one. Neither Jev nor the rule knew which company would come next.
I picked an arbitrary target to judge the results: the 90th percentile of possible portfolios.
After 100 rounds, portfolios built from Jev's ratings scored at the 79.05th percentile on average. They beat the random portfolio median in 91 rounds.
That's a good result. Those portfolios reached my 90th-percentile target in 37 rounds out of 100.
Here's how I ran the test and what those numbers mean.
The game
The rules are close to the live Investor Slides practice game:
- Every round has 50 random startup candidates.
- The decks come up one by one. Jev doesn't know which is next.
- It has 60 seconds and five investment slots.
- A pick uses a slot. Once it passes a startup, it can't go back.
- The amount of funding each startup raised stays hidden until the round is over.

Like in real VC, you don't know if the next investment is a better one.
At the end of a round, the game adds up the disclosed funding raised by Jev's five picks. It compares that total with all 2,118,760 possible five-company portfolios from the same 50 decks.
So a score at the 90th percentile means Jev's total beat about 90% of those combinations.
The game measures funding raised. It doesn't measure whether an investor would have made money. There is no purchase price, ownership stake, dilution, or exit value in the score. It also adds up disclosed funding regardless of when that funding was raised.
What Jev saw
Jev used model version jev-1.13.0. It got the name and visible category details for the current startup, plus up to 16,000 characters of pitch deck text from OCR. It couldn't see the slide images.
I asked Jev to rate how likely a startup looked to attract a large future funding raise. It gave each deck a rating from 0 (weak) to 4 (exceptional). This was Jev's judgment, not a funding amount or its game percentile.
How the five picks were chosen
Jev supplied the rating. A fixed rule I set before the test made every invest-or-pass decision:
- At first, it invested only in decks rated at least 3.1 out of 4.
- After eight ratings, it compared each new deck with the ones Jev had already rated that round. The bar was roughly the top 18% of those earlier ratings, kept between 2.0 and 3.1.
- As time or cards ran out, it lowered the bar to fill the remaining slots. If only enough cards were left to fill them, it had to invest.
The rule used Jev's ratings, the five slots, the cards left and the clock. It did not use Jev's confidence number or any funding outcome. So the results measure Jev's judgments combined with this slot-selection rule.
The rule filled all five slots in every one of the 100 rounds. It reached its last pick after a median of 28 cards and 11.6 seconds. The slowest round's last decision came at 23.6 seconds, well inside the one-minute limit.
The results: Jev's median round beat 86% of portfolios
| Measure | Result |
|---|---|
| Average percentile | 79.05th |
| Median percentile | 85.62nd |
| Standard deviation | 19.35 percentile points |
| Middle 50% of rounds | 64.54th to 95.26th |
| 95% bootstrap interval for the average | 75.21st to 82.71st |
| Rounds at or above the 50th percentile | 91 of 100 |
| Rounds at or above the 75th percentile | 66 of 100 |
| Rounds at or above the 90th percentile | 37 of 100 |
| Rounds at or above the 95th percentile | 26 of 100 |
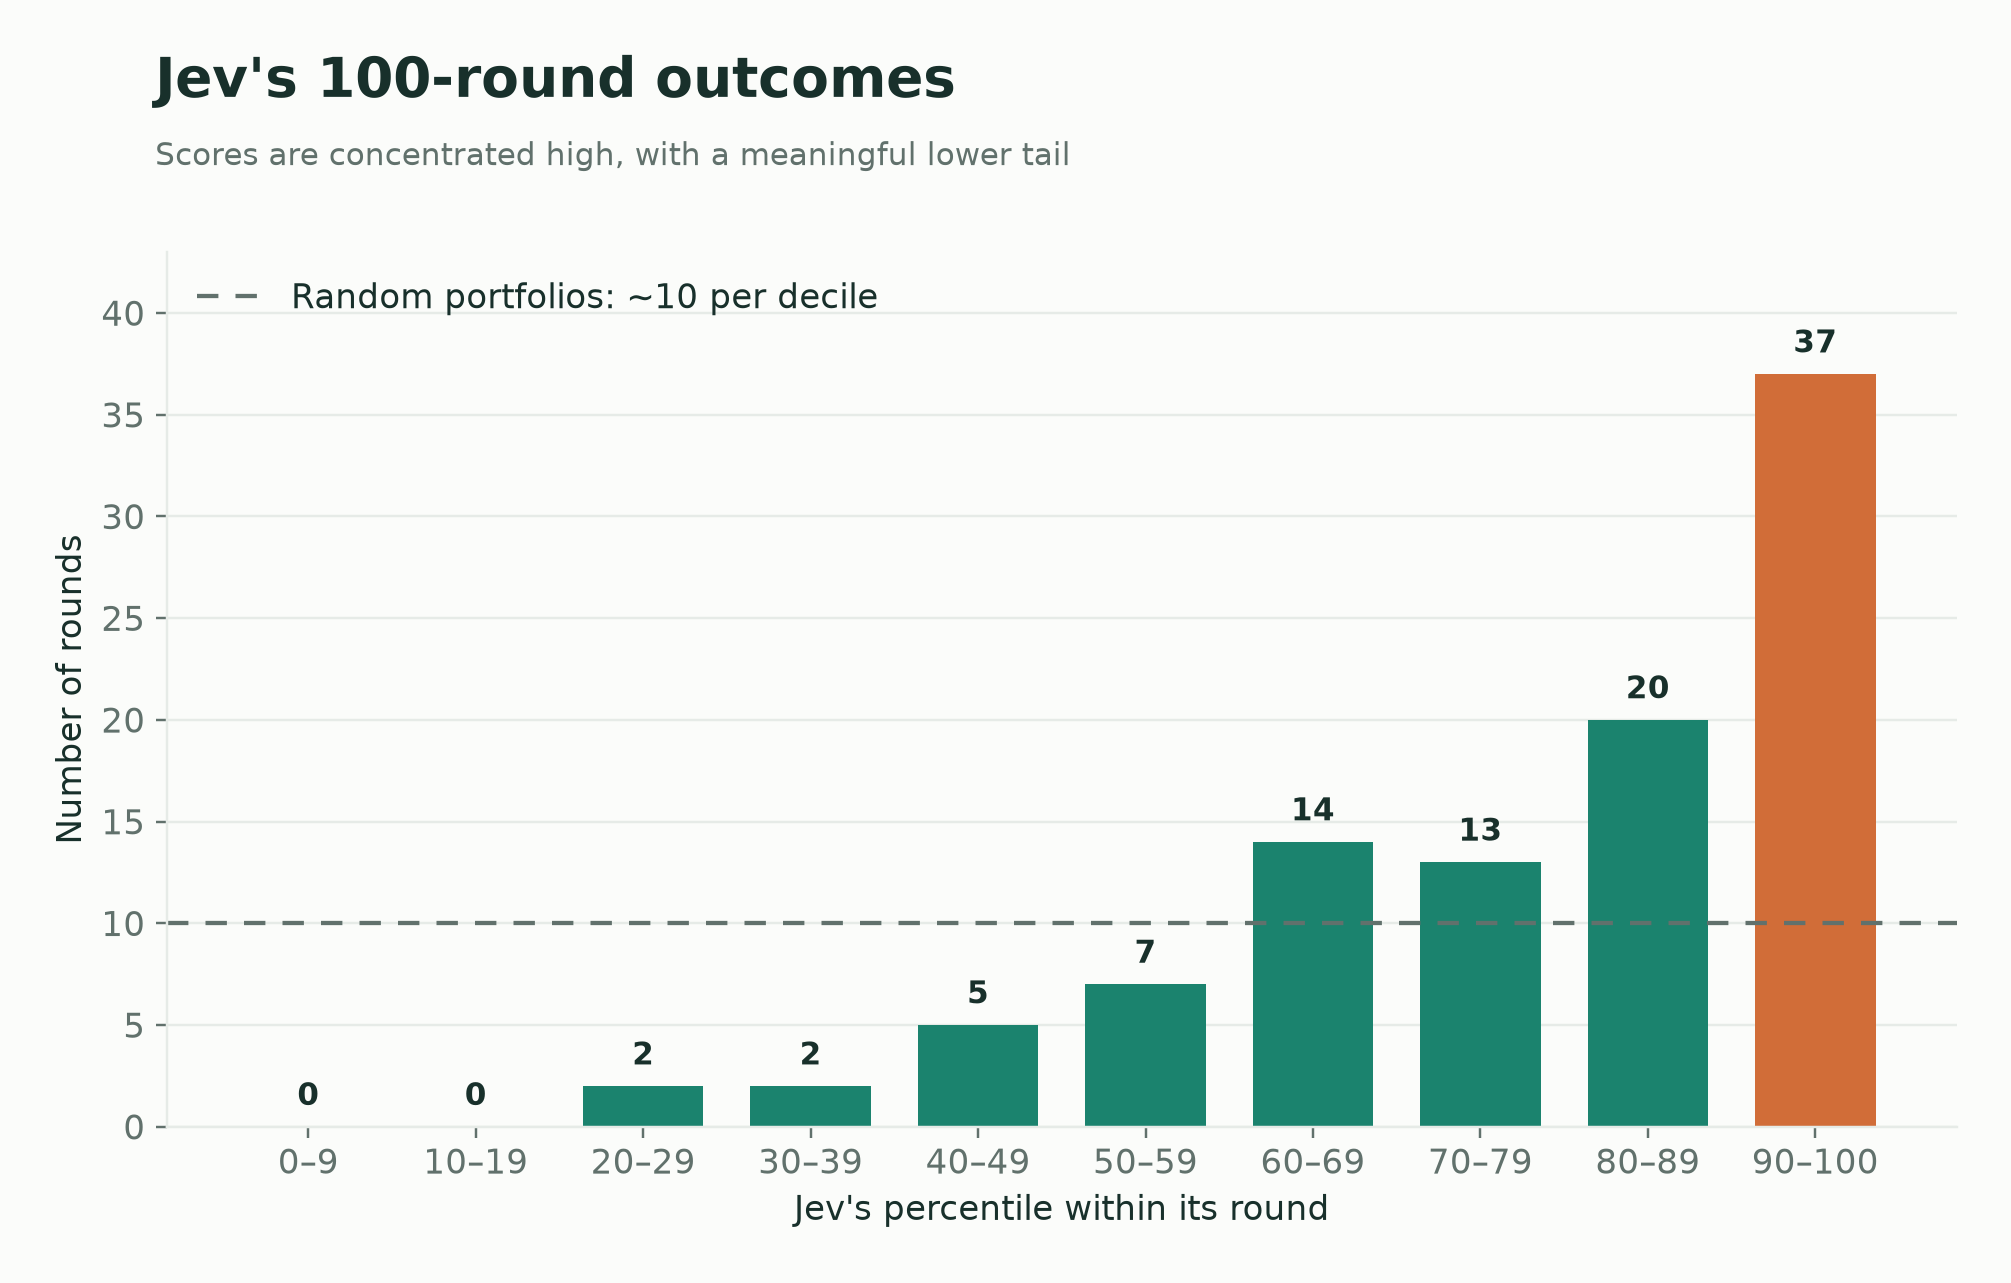
A random five-company portfolio should reach the top 10% about one time in ten. Jev did it 37 times in 100 rounds.
If Jev were choosing randomly and the rounds were independent, the chance of getting at least 37 top-decile rounds would be about 5.5 × 10⁻¹³. So the picks were doing much better than random at this game's funding score.
But 37 out of 100 also means Jev missed the 90th-percentile target 63 times. Its estimated top-decile hit rate has a 95% Wilson interval of 28.2% to 46.8%. I would call that good against the random benchmark, but I wouldn't call it a reliable top-decile player.
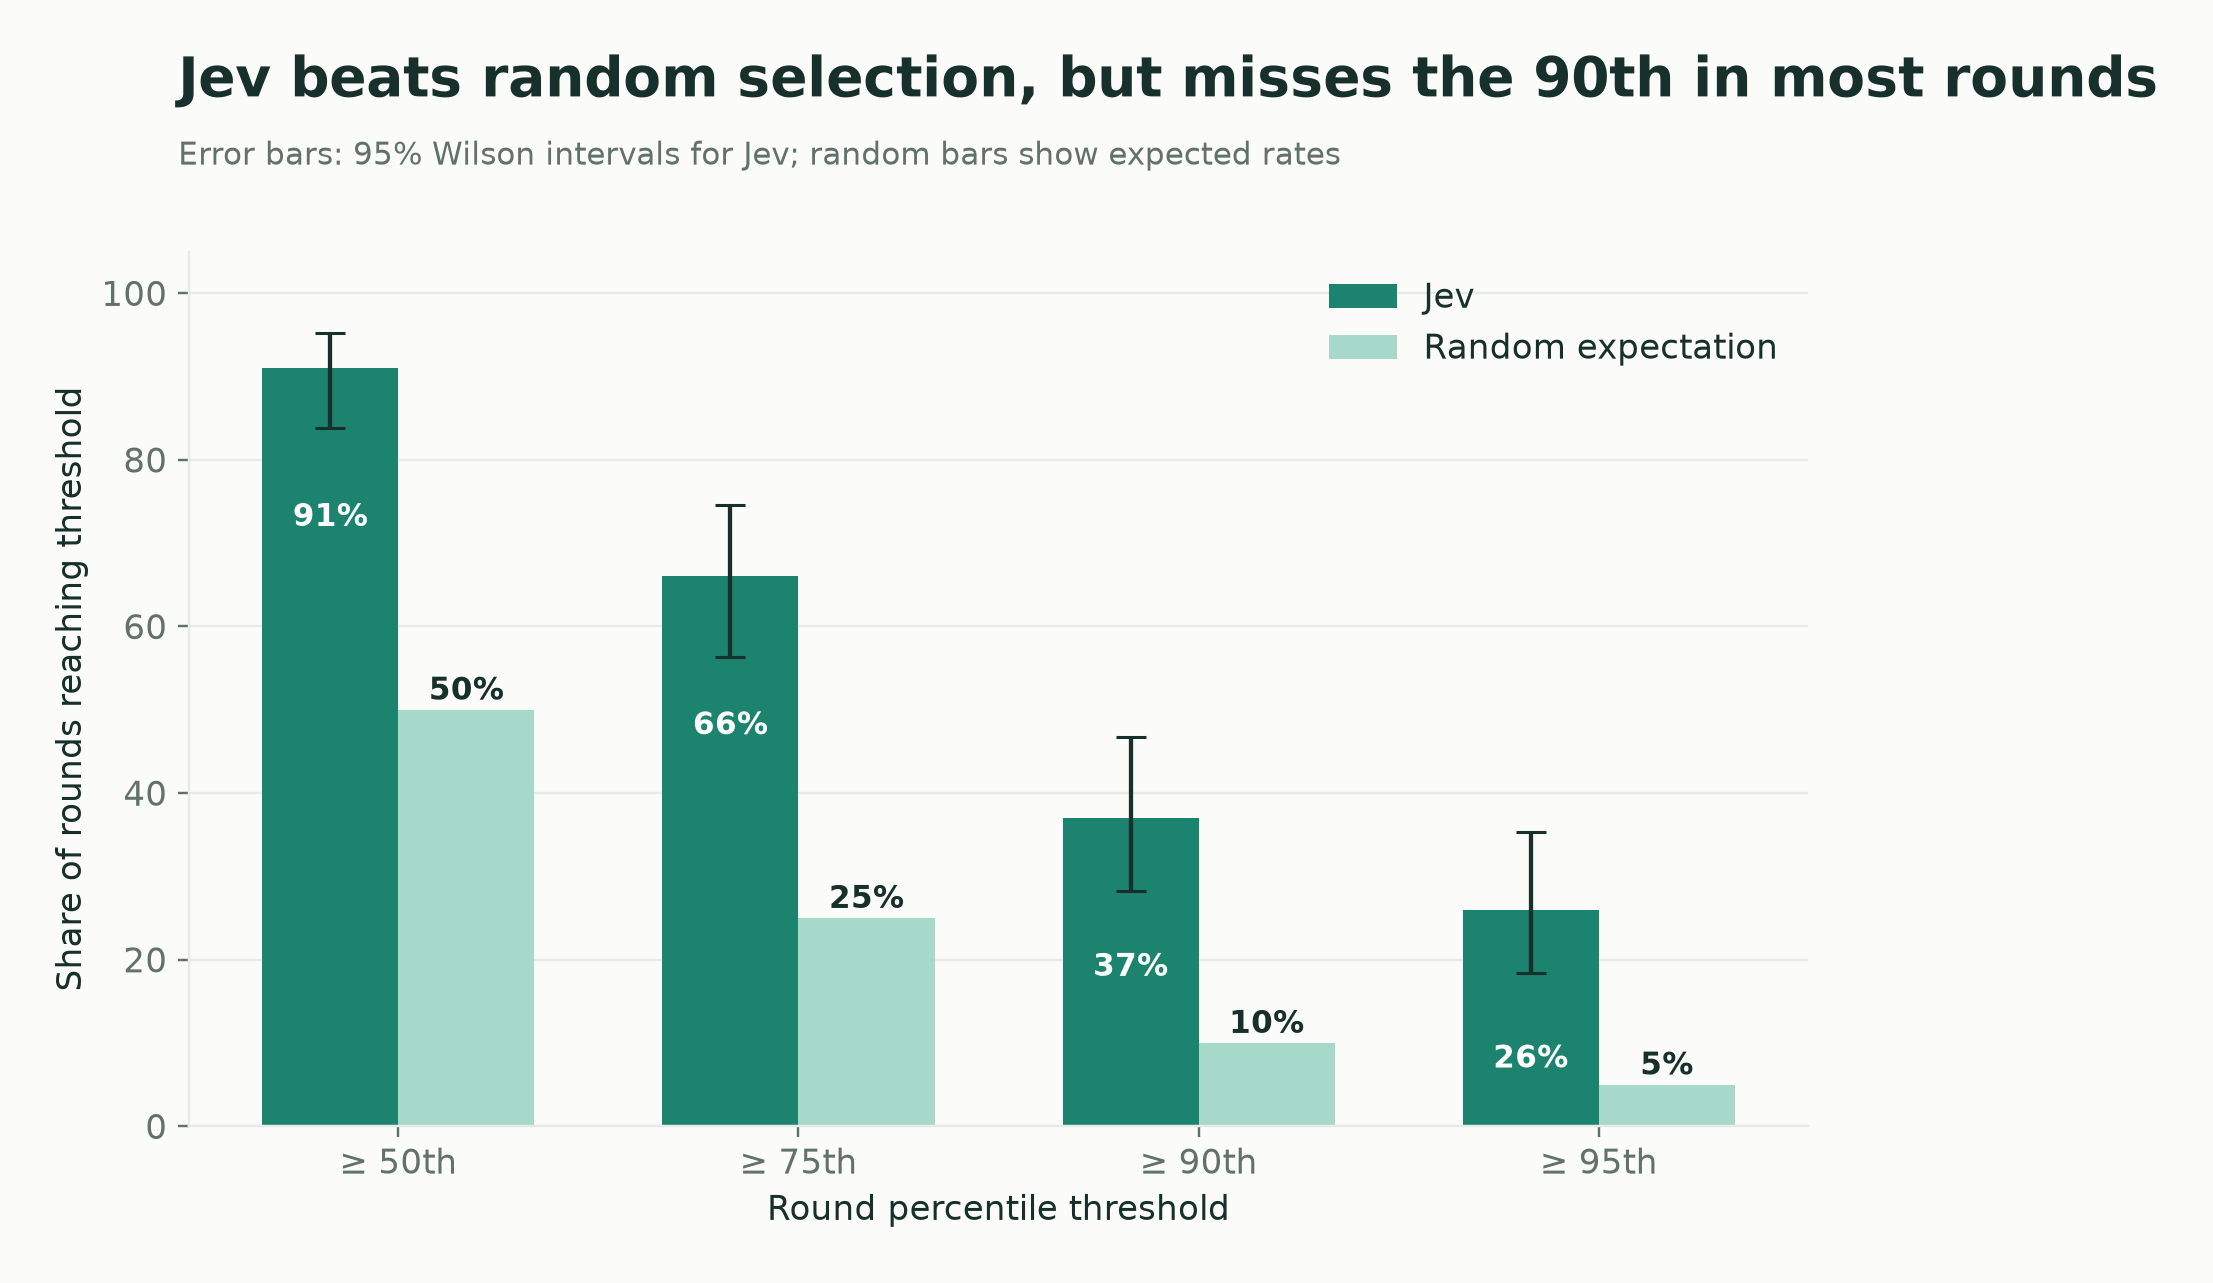
A few bad rounds pulled down the average. Jev beat the random median in 91 rounds
The median was 85.62nd percentile, while the average was 79.05th. The weak rounds pulled the average down.
Nine rounds finished below the 50th percentile, and the worst was near the 20th.
There is also less room to go up when you're already near the top. A round at the 85th percentile can gain only 15 points, but it can lose far more.
The standard deviation was 19.35 percentile points. That describes how much the individual rounds moved around. The narrower bootstrap interval in the table is about how precisely we know the average.
The first five rounds made Jev look especially good. Their average was 85.38th percentile, and two were above the 90th.
Those early portfolios included companies like Scale AI and Wayfair, whose large disclosed funding totals pushed up the scores.
I kept playing. The next ten rounds averaged 75.07th percentile. The following 85 standalone rounds averaged 79.15th.
By round 100, the running average had settled at 79.05th. The first five were a better run than the full experiment.
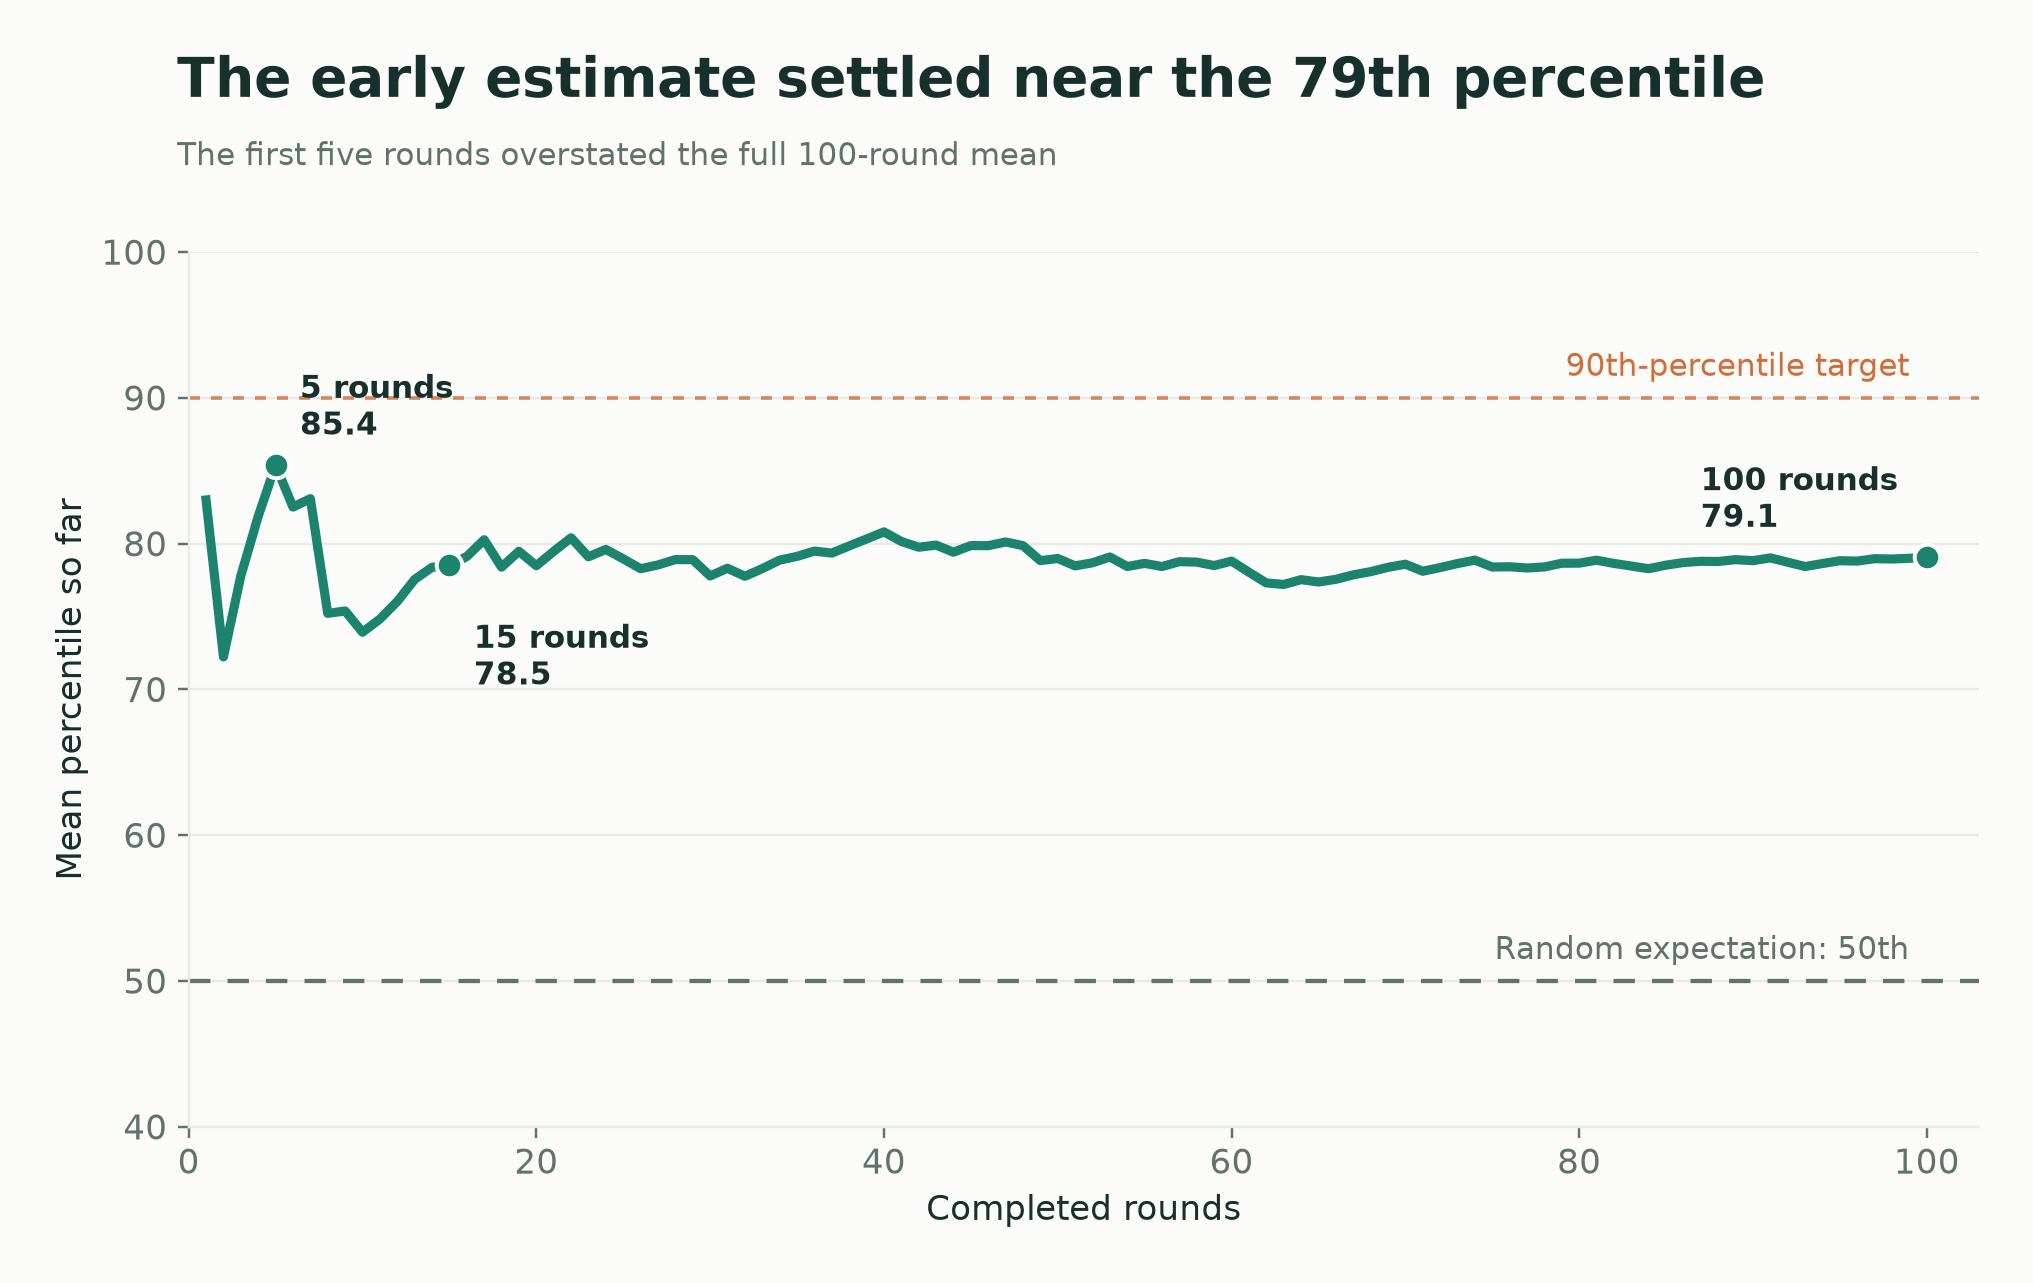
Big funding picks drove the best rounds
I looked at what happened in Jev's stronger rounds. When it picked no company with at least $100 million raised, its median result was the 54th percentile. With one, it was the 85th. With two or more, it was the 98th.
Of Jev's 500 picks, 118 had raised at least $100 million. Randomly picking five from the OCR-readable decks Jev reviewed in each round would have found about 62.
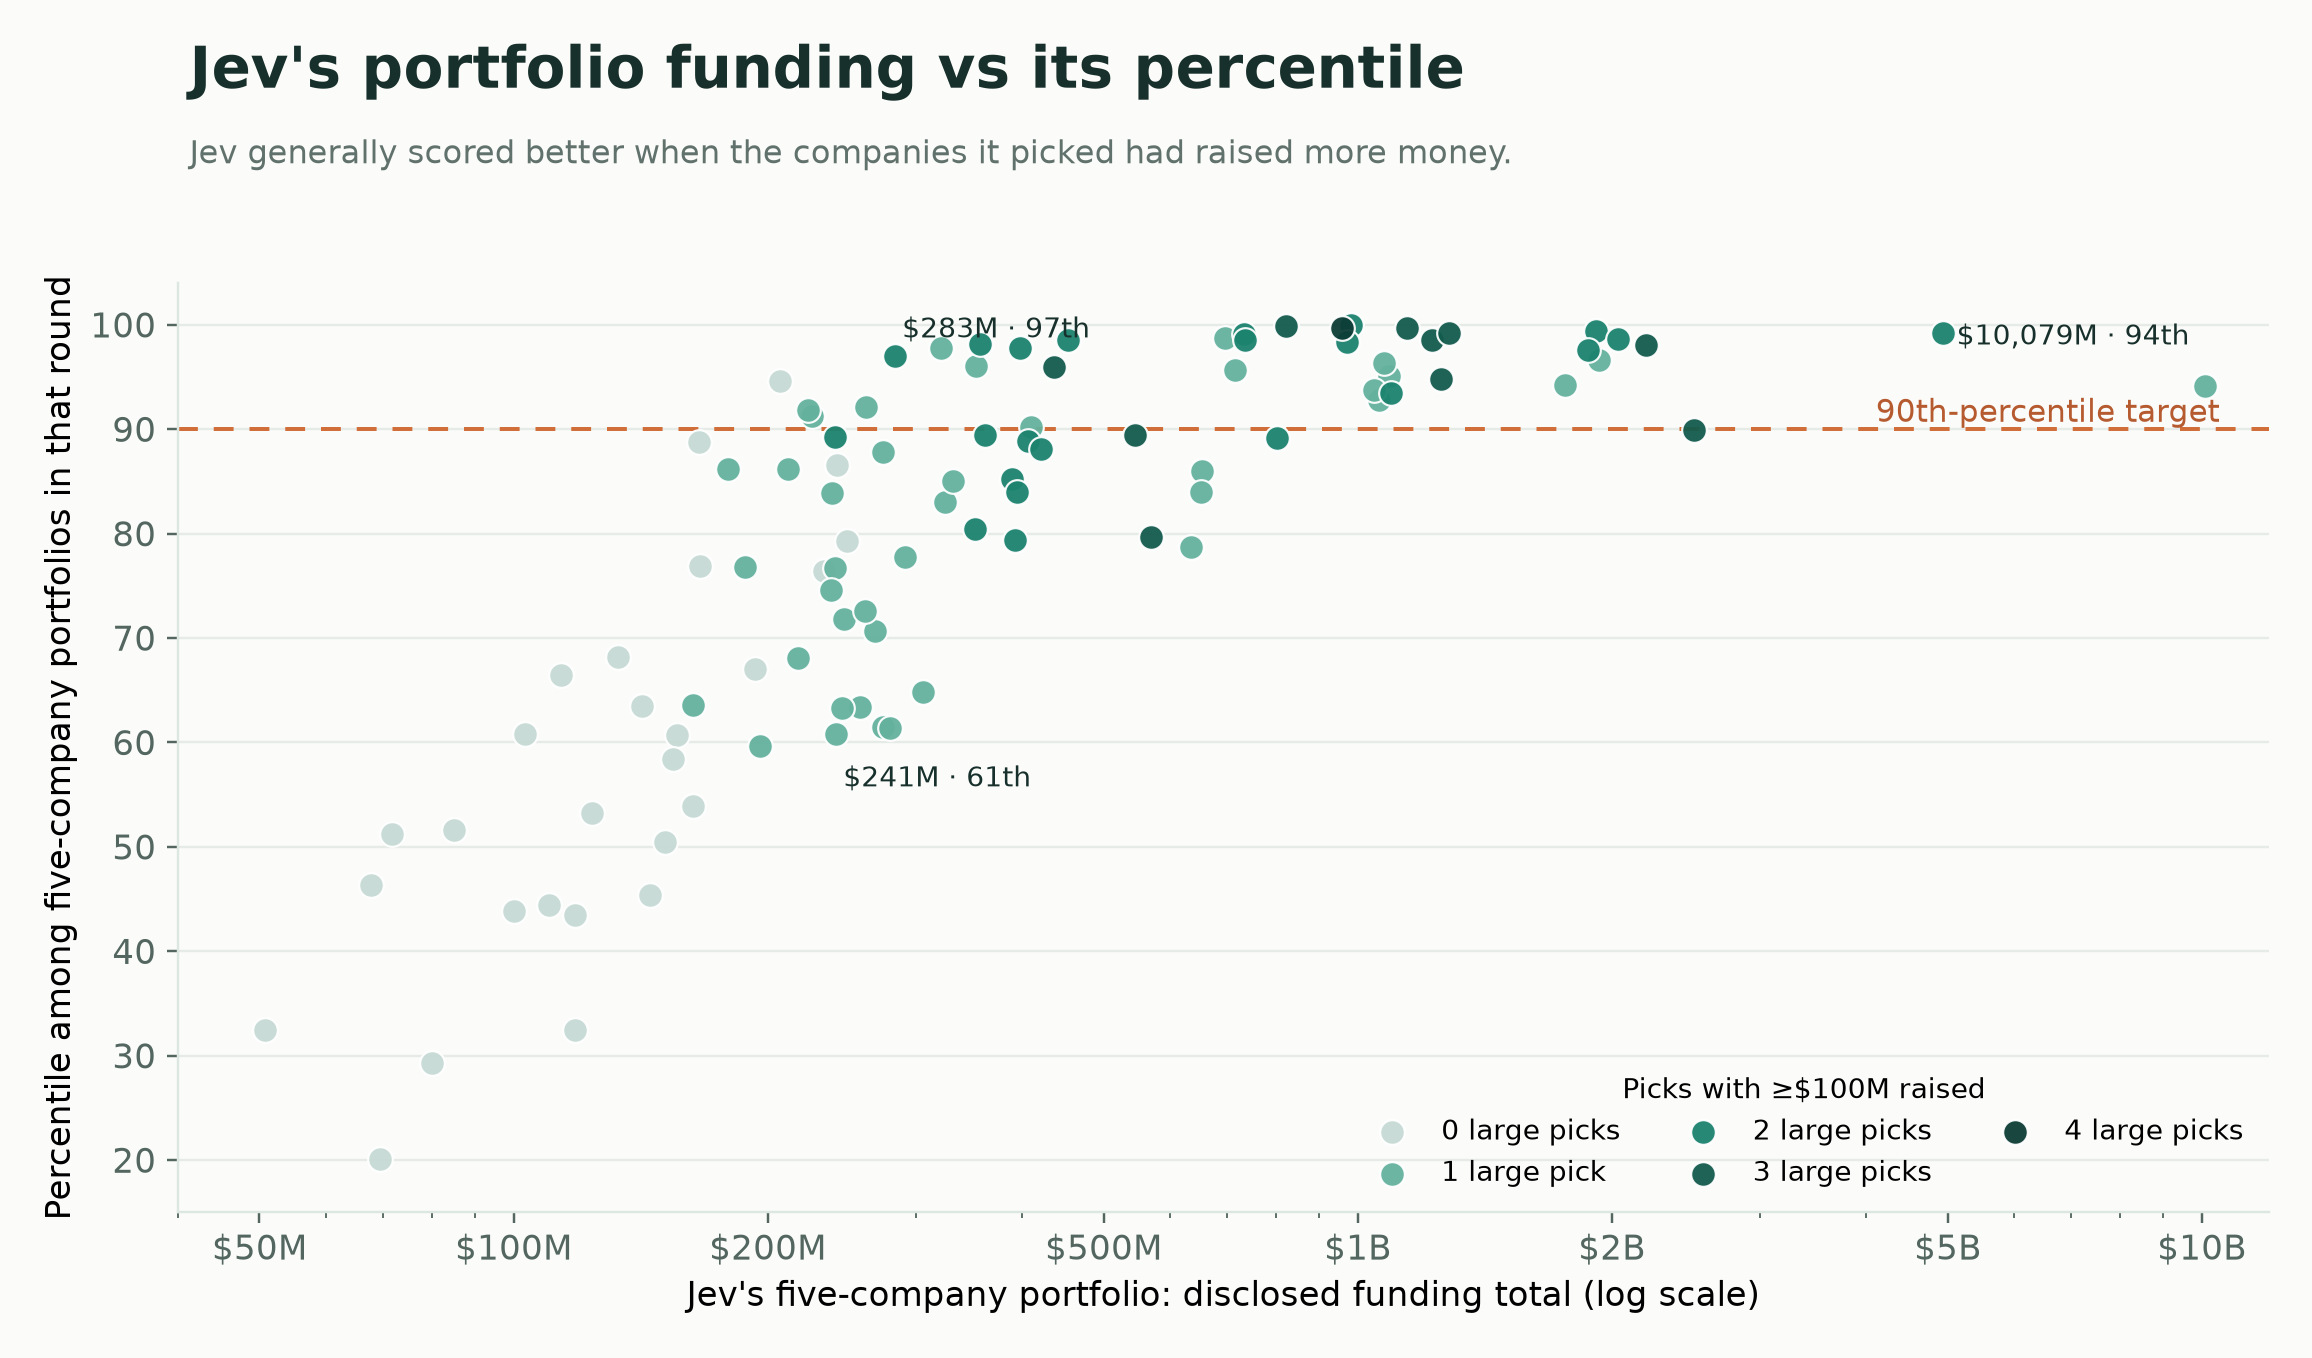
Portfolio size wasn't the whole story. $241 million ranked 61st in one round; $283 million ranked 97th in another, because the 50 candidates differed.
Jev's performance came from its strong ability of judging individual startups
Separately, I checked whether Jev's ratings tracked individual startups, not just the final five-pick portfolios. Across 1,206 distinct decks it could read, the rating and the company's disclosed funding had a 0.52 rank correlation. The relationship was positive within 99 of the 100 rounds.
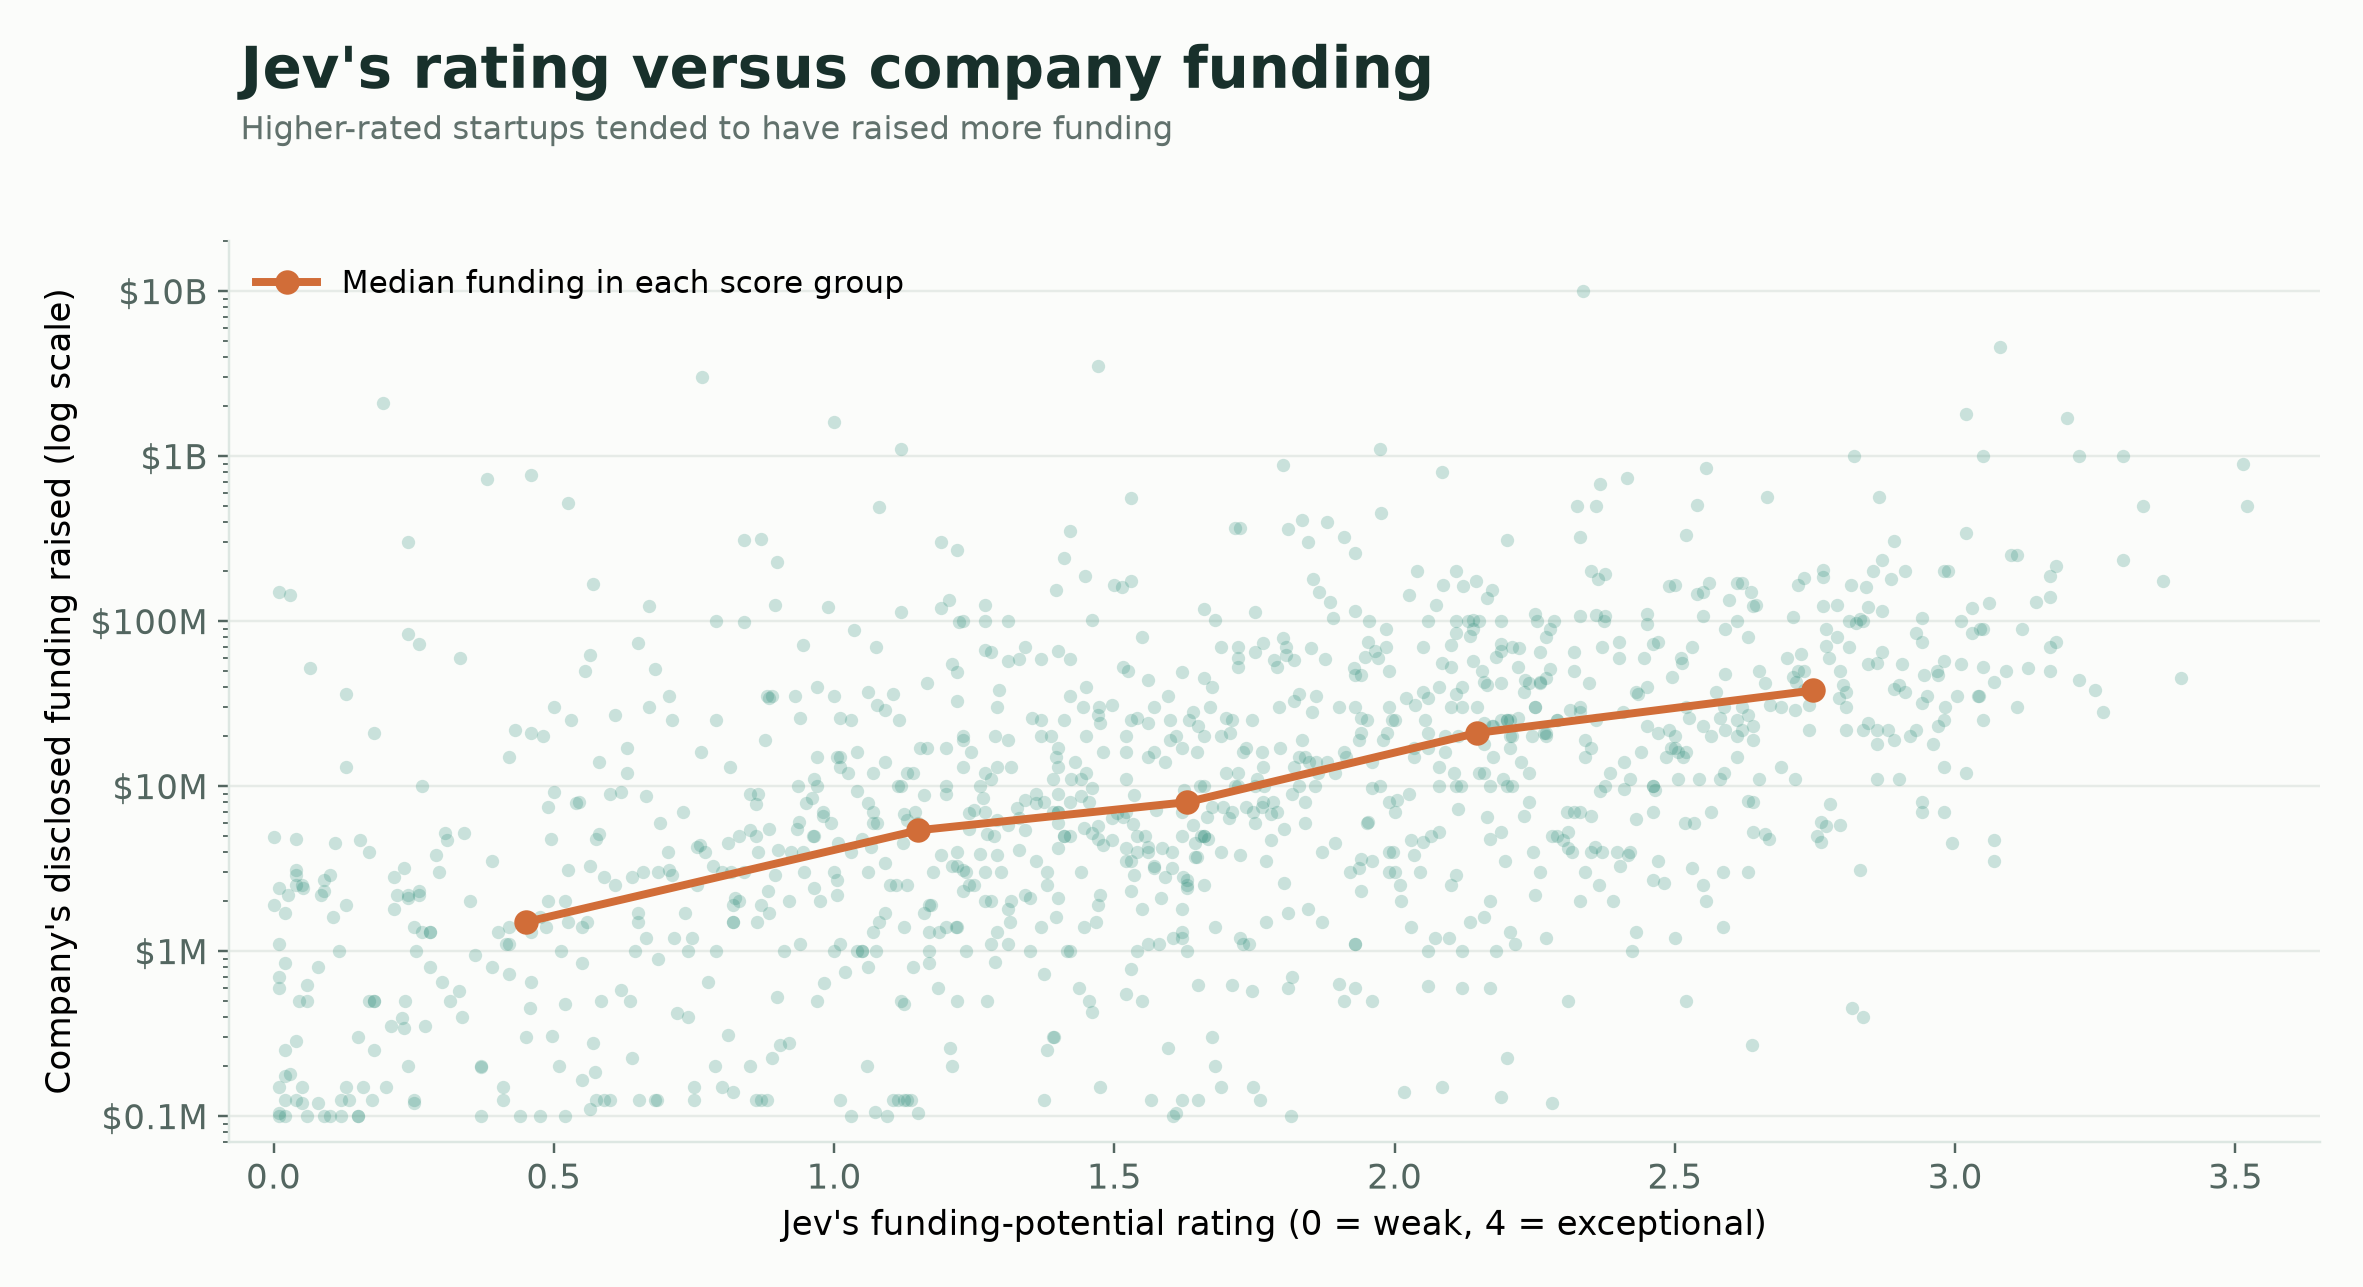
Each dot is one deck. The orange line joins the median funding for five equally sized groups of Jev's ratings. It bends because those five medians don't rise evenly; it's not a fitted prediction line.
The lowest-scoring fifth had a median of $1.5 million raised. The highest-scoring fifth had $38 million.
And 5% of the lowest fifth had raised at least $100 million, compared with 26% of the highest fifth. If I compare one company above that $100 million mark with one below it, Jev gave the higher-funding company a higher score about 70% of the time.
I also checked whether this varied by industry. Within each industry, I compared the top 25% of decks by disclosed funding with the other 75%. Jev's ratings separated these groups best for E-Commerce & Retail (0.81 across 111 decks) and least well for AI & Data (0.59 across 84). On this measure, 0.50 is chance. Software, FinTech and Healthcare were between 0.69 and 0.73.
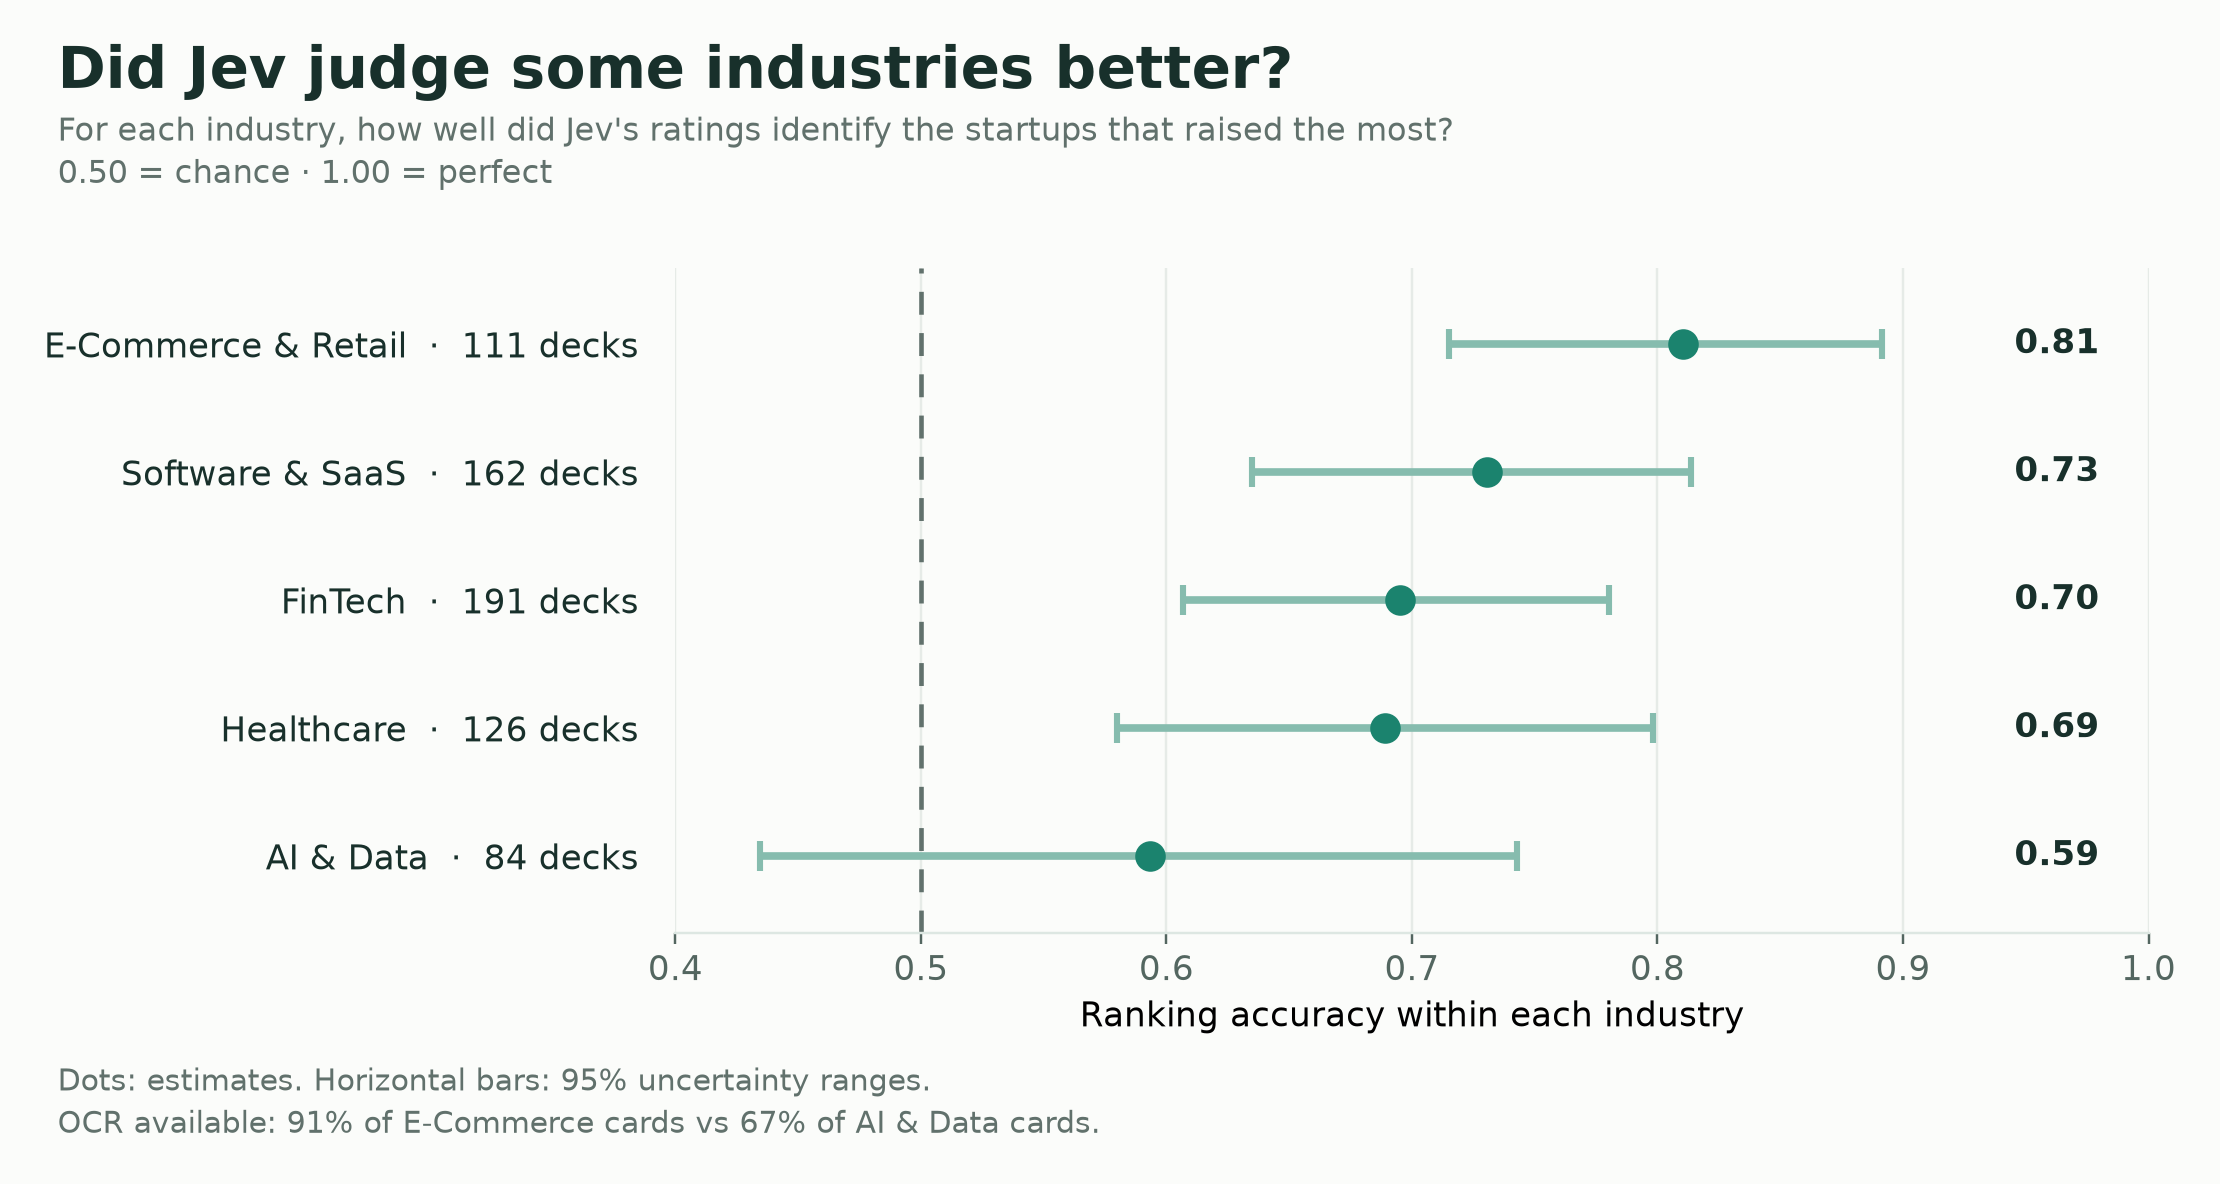
The horizontal bars show uncertainty in each estimate, and several overlap. Jev had OCR text for 91% of reviewed E-Commerce cards and only 67% of AI & Data cards. The industry labels are broad, too. It's an interesting pattern, not a firm claim that Jev judges one industry better.
Caveat: Jev could only read slide text
Jev couldn't see charts, visuals, or product demos. Did that hurt it? Maybe. Plain text might also keep it from being impressed by fancy graphics. This test can't tell.
I'll be honest: the OCR wasn't great. Jev had no slide text for 621 of the 2,969 cards it reviewed. Despite that handicap, its portfolios still performed well.
Across the test, the 2,969 card appearances came from 1,528 distinct decks; some companies appeared more than once. The missing-text cards made up 20.9% of appearances. Jev still saw their names and card details, but picked none of them. Thirty-nine of those appearances had disclosed funding of at least $100 million.
Missing text can't explain every miss. Jev also passed on well-funded startups whose decks did have OCR.
The names were visible. Jev might know a familiar startup from earlier training, just as a human player might. It never saw the hidden funding labels before deciding. Masking names would help test what Jev can infer from the pitch alone.
Jev followed the same 60-second clock, but read OCR much faster than a person. This wasn't a head-to-head test against human investors.
What these results tell us
The average of 79.05th percentile has a 95% bootstrap interval from 75.21st to 82.71st. That range reflects how results varied across the sampled rounds. It is well above the roughly 50th percentile expected from a random portfolio.
The bigger limitation is the game's measure. Funding raised is a sign that a company attracted capital, but it isn't an angel investor's return.
The score leaves out valuation, dilution, losses, exits, and what an investor could have known at the time. The game also uses a curated pool of companies with published decks and funding labels. That's a narrower pool than the pitches an investor normally gets.
So tldr: Jev's ratings helped a simple rule pick startups from pitch deck text in this game. The resulting portfolios beat random by a lot. They weren't consistently in the top 10%, and I wouldn't use this result to claim Jev can make money as an angel investor.